Vismatica : Advanced Data Visualisation for Optimal Decision Making
Vismatica: in summary
What are the main features of Vismatica?
Interactive Graphical Visualisations
Bring your data to life with dynamic graphical visualisations that adapt to your needs. Vismatica offers a range of chart types and customisation options to ensure your data is both visually appealing and informative.
- Wide selection of chart types including bar, pie, and line.
- Customisable colour schemes and themes.
- Zoom and pan capabilities for detailed data analysis.
Custom Dashboards for Personalised Insights
Create personalised dashboards that consolidate multiple data sources into a single view. Vismatica allows users to design their dashboards according to specific business needs, streamlining decision-making processes.
- Drag-and-drop interface for easy dashboard creation.
- Real-time updates for the most accurate data representation.
- Compatibility with various data sources for a comprehensive view.
Seamless Integration with Existing Systems
Enhance your data analysis capabilities with seamless integration features of Vismatica. It supports integration with a multitude of third-party applications, making it easier to incorporate into your existing workflows.
- Support for popular data formats like CSV, Excel, and SQL.
- API access for developer-level customisation.
- Integration with cloud services and enterprise applications.
In-Depth Reporting and Analysis
With Vismatica's powerful analytics tools, users can delve deep into their data, uncovering trends and insights that drive business growth. Generate comprehensive reports that highlight critical metrics.
- Detailed reports with export options.
- Automated reporting based on scheduled tasks.
- Advanced analytics plug-ins.
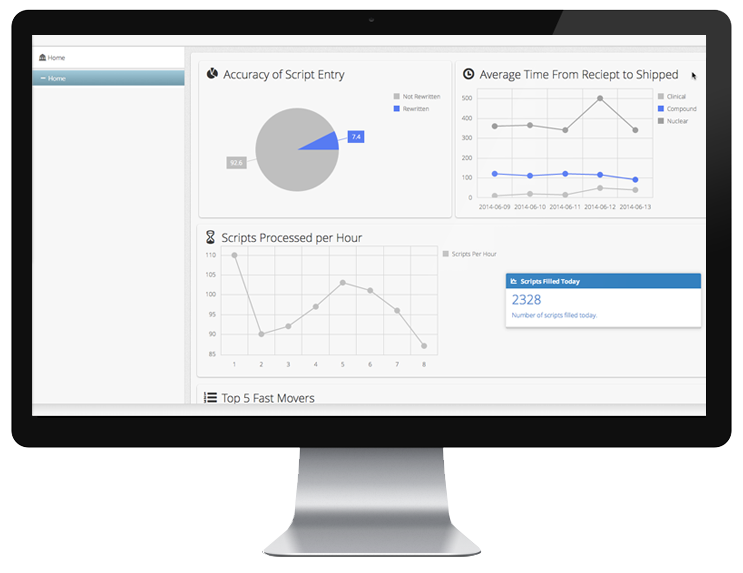 Vismatica - Vismatica-screenshot-0
 Vismatica: its rates
standard
Rate
On demand
Clients alternatives to Vismatica
Business Intelligence software for data-driven decisions. Customizable dashboards, real-time data visualization, and easy-to-use interface.
See more details See less details
DigDash Enterprise offers advanced data analytics tools for businesses of all sizes. With powerful reporting capabilities and seamless integration with existing systems, users can gain valuable insights into their operations and make informed decisions.
Read our analysis about DigDash EnterpriseBenefits of DigDash Enterprise
Agile
Easy
Strong
To DigDash Enterprise product page
Transform your data into actionable insights with this powerful dashboard software. Visualize your KPIs, track performance, and make informed decisions.
See more details See less details
With its intuitive interface and customizable dashboards, this software makes it easy to monitor your business metrics in real-time. Its advanced analytics tools enable you to drill down into your data and uncover trends and patterns. Plus, with automated reporting and alerting features, you'll never miss a critical update.
Read our analysis about IQubz Reporting & AnalyticsTo IQubz Reporting & Analytics product page
Create custom reports and visualisations with this dashboard software.
See more details See less details
JasperReports Server allows for easy report creation and customisation, with a variety of data sources and visualisation options. Users can schedule reports, set up security, and access reports from any device.
Read our analysis about JasperReports ServerTo JasperReports Server product page
Appvizer Community Reviews (0) The reviews left on Appvizer are verified by our team to ensure the authenticity of their submitters.
Write a review No reviews, be the first to submit yours.