ZingChart : Dynamic Charting Software Empowering Data Visualisation
ZingChart: in summary
ZingChart is a robust charting library designed for developers and data analysts seeking dynamic and interactive data visualisation. Its main strengths include a versatile API, real-time updates, and extensive customisation options, making it a top choice for data-driven professionals.
What are the main features of ZingChart?
Versatile API Capabilities
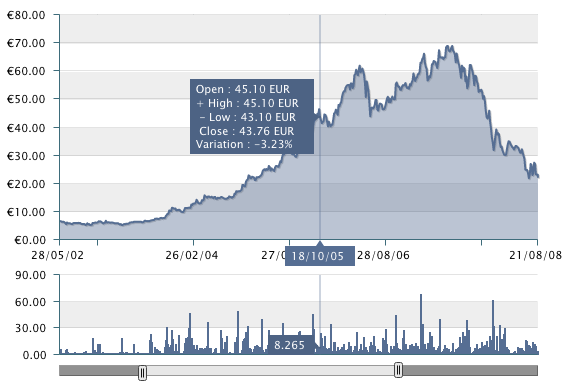
ZingChart offers a highly flexible API that allows developers to integrate a wide range of chart types and styles. This adaptability ensures seamless compatibility with various platforms, providing a tailored experience for diverse projects.
- Supports over 35 chart types, including bar, line, and pie charts.
- Customisable chart axes and legends for specific data visualisation needs.
- Interactive features such as scroll, zoom, and panning.
Real-Time Data Updates
In the fast-paced world of data analysis, real-time reporting is crucial. ZingChart excels in delivering live data updates, allowing users to view and respond to changes immediately, keeping their analyses timely and relevant.
- Data streaming through WebSockets for instantaneous updates.
- Event-driven data handling for dynamic changes.
- Real-time dashboards that reflect live data amendments seamlessly.
Extensive Customisation Options
ZingChart offers profound customisation opportunities to match your brand identity and specific analytical needs. Its extensive features help create unique, visually appealing charts that stand out.
- Personalised themes and style adjustments for brand consistency.
- Advanced colouring schemes and gradient support.
- Custom animations to enhance user interaction and engagement.
 ZingChart - ZingChart-screenshot-0
 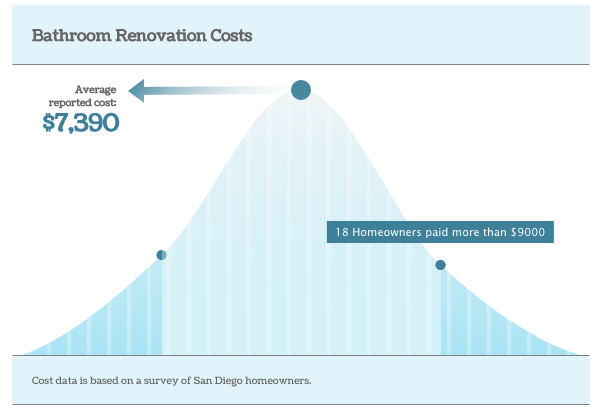 ZingChart - ZingChart-screenshot-1
 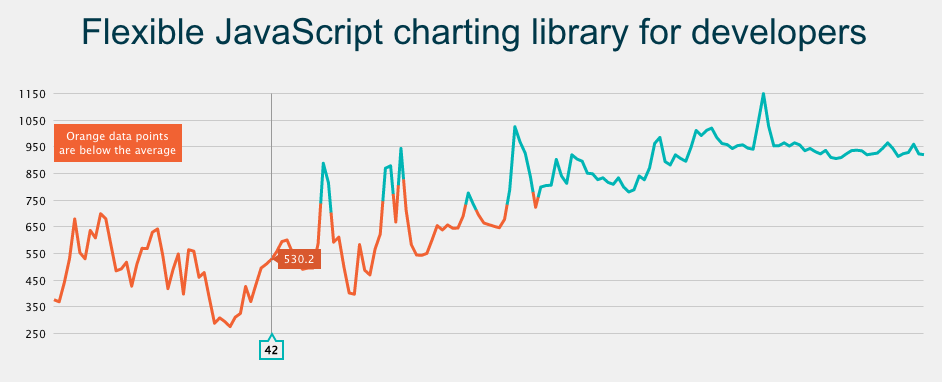 ZingChart - ZingChart-screenshot-2
  ZingChart - ZingChart-screenshot-3
 ZingChart: its rates
standard
Rate
On demand
Clients alternatives to ZingChart
Business Intelligence software for data-driven decisions. Customizable dashboards, real-time data visualization, and easy-to-use interface.
See more details See less details
DigDash Enterprise offers advanced data analytics tools for businesses of all sizes. With powerful reporting capabilities and seamless integration with existing systems, users can gain valuable insights into their operations and make informed decisions.
Read our analysis about DigDash EnterpriseBenefits of DigDash Enterprise
Agile
Easy
Strong
To DigDash Enterprise product page
Visualize your network data with ease. Get insights on your device performance, bandwidth usage, and more.
See more details See less details
With intuitive dashboards and customizable reports, you can easily identify network issues and optimize performance. The software offers real-time monitoring, alerting, and historical data analysis for better decision-making.
Read our analysis about Nagios Network AnalzyerTo Nagios Network Analzyer product page
Create stunning data visualisations with this SaaS software.
See more details See less details
With this software, you can easily import your data and choose from a variety of templates to create custom visualisations. Interactive charts and graphs can be shared with your team or clients through a secure link.
Read our analysis about XtensioTo Xtensio product page
Appvizer Community Reviews (0) The reviews left on Appvizer are verified by our team to ensure the authenticity of their submitters.
Write a review No reviews, be the first to submit yours.